Chart Class Reference
#include <chart.h>
Inheritance diagram for Chart:

Collaboration diagram for Chart:

Public Member Functions | |
| Chart (Plot *plot, const wxString &title=wxEmptyString, const wxColour &bgColor=wxColour(220, 220, 220)) | |
| Chart (Plot *plot, Header *header=NULL, Footer *footer=NULL, const wxColour &bgColor=wxColour(220, 220, 220)) | |
| Plot * | GetPlot () |
| void | Draw (wxDC &dc, wxRect &rc) |
| void | SetBackground (AreaDraw *background) |
| void | SetTitle (wxString title) |
| void | SetHeader (Header *header) |
| void | SetFooter (Footer *footer) |
| void | SetMargin (wxCoord margin) |
| void | SetScrolledAxis (Axis *axis) |
| Axis * | GetHorizScrolledAxis () |
| Axis * | GetVertScrolledAxis () |
| wxChartPanel * | GetChartPanel () |
| void | SetChartPanel (wxChartPanel *chartPanel) |
| virtual void | PlotNeedRedraw (Plot *plot) |
| virtual void | AxisChanged (Axis *axis) |
| virtual void | BoundsChanged (Axis *axis) |
 Public Member Functions inherited from Observable< ChartObserver > Public Member Functions inherited from Observable< ChartObserver > | |
| void | AddObserver (ChartObserver *_observer) |
| void | RemoveObserver (ChartObserver *_observer) |
Additional Inherited Members | |
 Public Types inherited from Observable< ChartObserver > Public Types inherited from Observable< ChartObserver > | |
| typedef ChartObserver | Observer |
 Public Attributes inherited from Observable< ChartObserver > Public Attributes inherited from Observable< ChartObserver > | |
|
std::vector< ChartObserver * > ::iterator | OIt |
 Protected Attributes inherited from Observable< ChartObserver > Protected Attributes inherited from Observable< ChartObserver > | |
| std::vector< ChartObserver * > | observers |
Detailed Description
Chart. Contains plot, title and chart attributes.
Constructor & Destructor Documentation
| Chart::Chart | ( | Plot * | plot, |
| const wxString & | title = wxEmptyString, |
||
| const wxColour & | bgColor = wxColour(220, 220, 220) |
||
| ) |
Constructs new chart.
- Parameters
-
plot plot title chart title (empty string - no title)
Member Function Documentation
|
virtual |
|
virtual |
Called when axis bounds are changed.
- Parameters
-
axis axis that bounds are changed
Implements AxisObserver.
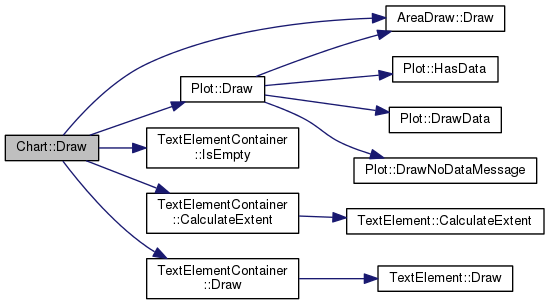
| void Chart::Draw | ( | wxDC & | dc, |
| wxRect & | rc | ||
| ) |
Draws chart.
- Parameters
-
dc device context rc rectangle where to draw chart
Here is the call graph for this function:

|
inline |
Returns plot associated with chart.
- Returns
- plot
|
virtual |
Called when plot has been changed and need to be redrawn.
- Parameters
-
_plot plot
Implements PlotObserver.
|
inline |
Sets chart background.
- Parameters
-
background chart background
|
inline |
Calcalate plot area rectangle.
- Parameters
-
dc device context rc entire chart rectangle
- Returns
- plot area rectangle Sets chart title.
- Parameters
-
title chart title
The documentation for this class was generated from the following files:
- /home/bishop/work/projects/nextgismanager/include/freechart/wx/chart.h
- /home/bishop/work/projects/nextgismanager/src/freechart/chart.cpp


