#include <axisplot.h>

Public Member Functions | |
| void | AddAxis (Axis *axis) |
| void | AddDataset (Dataset *dataset) |
| void | RemoveDataset (Dataset *dataset) |
| void | RemoveDataset (size_t index) |
| void | AddObjects (Dataset *dataset, Axis *verticalAxis, Axis *horizontalAxis) |
| size_t | GetDatasetCount () |
| Dataset * | GetDataset (size_t index) |
| void | LinkDataHorizontalAxis (size_t nData, size_t nAxis) |
| void | LinkDataVerticalAxis (size_t nData, size_t nAxis) |
| Axis * | GetDatasetAxis (Dataset *dataset, size_t index, bool vertical) |
| Axis * | GetDatasetAxis (Dataset *dataset, bool vertical) |
| Axis * | GetDatasetVerticalAxis (Dataset *dataset) |
| Axis * | GetDatasetHorizontalAxis (Dataset *dataset) |
| Dataset * | GetAxisDataset (Axis *axis, size_t index) |
| void | SetDrawGrid (bool drawGridVertical, bool drawGridHorizontal) |
| void | SetDataBackground (AreaDraw *dataBackground) |
| void | SetLegend (Legend *legend) |
| void | SetCrosshair (Crosshair *crosshair) |
| bool | ToDataCoords (size_t nData, wxDC &dc, wxRect rc, wxCoord gx, wxCoord gy, double *x, double *y) |
| virtual void | NeedRedraw (DrawObject *obj) |
| virtual void | DatasetChanged (Dataset *dataset) |
| virtual void | AxisChanged (Axis *axis) |
| virtual void | BoundsChanged (Axis *axis) |
| virtual void | ChartMouseDown (wxPoint &pt, int key) |
 Public Member Functions inherited from Plot Public Member Functions inherited from Plot | |
| virtual void | Draw (wxDC &dc, wxRect rc) |
| virtual void | DrawNoDataMessage (wxDC &dc, wxRect rc) |
| void | SetChartPanel (wxChartPanel *chartPanel) |
| wxChartPanel * | GetChartPanel () |
| void | SetBackground (AreaDraw *background) |
| void | SetTextNoData (const wxString &textNoData) |
 Public Member Functions inherited from Observable< PlotObserver > Public Member Functions inherited from Observable< PlotObserver > | |
| void | AddObserver (PlotObserver *_observer) |
| void | RemoveObserver (PlotObserver *_observer) |
 Public Member Functions inherited from ChartPanelObserver Public Member Functions inherited from ChartPanelObserver | |
| virtual void | ChartEnterWindow () |
| virtual void | ChartMouseUp (wxPoint &pt, int key) |
| virtual void | ChartMouseMove (wxPoint &pt) |
| virtual void | ChartMouseDrag (wxPoint &pt) |
| virtual void | ChartMouseWheel (int rotation) |
Protected Member Functions | |
| virtual bool | AcceptAxis (Axis *axis)=0 |
| virtual bool | AcceptDataset (Dataset *dataset)=0 |
| virtual void | DrawDatasets (wxDC &dc, wxRect rc)=0 |
| wxCoord | GetAxesExtent (wxDC &dc, AxisArray *axes) |
 Protected Member Functions inherited from Plot Protected Member Functions inherited from Plot | |
| FIRE_WITH_THIS (PlotNeedRedraw) | |
Additional Inherited Members | |
 Public Types inherited from Observable< PlotObserver > Public Types inherited from Observable< PlotObserver > | |
| typedef PlotObserver | Observer |
 Public Attributes inherited from Observable< PlotObserver > Public Attributes inherited from Observable< PlotObserver > | |
|
std::vector< PlotObserver * > ::iterator | OIt |
 Protected Attributes inherited from Observable< PlotObserver > Protected Attributes inherited from Observable< PlotObserver > | |
| std::vector< PlotObserver * > | observers |
Detailed Description
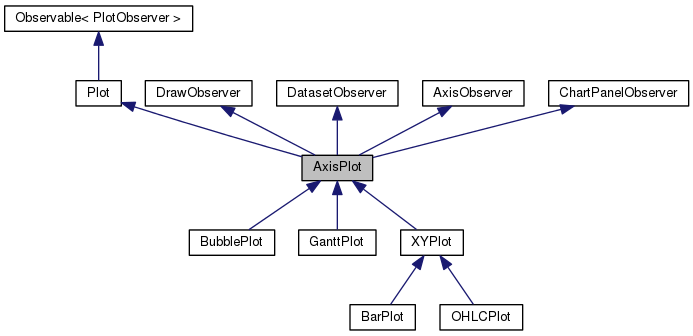
Base class for plots that supports axes.
Member Function Documentation
|
protectedpure virtual |
Checks whether axis is acceptable with this plot.
- Parameters
-
axis axis to be checked
- Returns
- true if axis can be accepted, false overwise
Implemented in XYPlot, OHLCPlot, BarPlot, GanttPlot, and BubblePlot.

|
protectedpure virtual |
Checks whether dataset is acceptable with this plot.
- Parameters
-
dataset dataset to be checked
- Returns
- true if dataset can be accepted, false overwise
Implemented in XYPlot, OHLCPlot, BarPlot, GanttPlot, and BubblePlot.

| void AxisPlot::AddAxis | ( | Axis * | axis | ) |
Adds axis to plot.
- Parameters
-
axis axis to be added


| void AxisPlot::AddDataset | ( | Dataset * | dataset | ) |
Adds dataset to plot.
- Parameters
-
dataset dataset to be added


Adds dataset and vertical and horizontal axes to plot. And links it all together.
- Parameters
-
dataset dataset to be added verticalAxis vertical axis to be added horizontalAxis horizontal axis to be added

|
virtual |
|
virtual |
Called when axis bounds are changed.
- Parameters
-
axis axis that bounds are changed
Implements AxisObserver.
|
protectedpure virtual |
Called to draw all datasets.
- Parameters
-
dc device context rc rectangle where to draw
Implemented in XYPlot, OHLCPlot, BarPlot, GanttPlot, and BubblePlot.
Returns dataset, linked with axis at specified index.
- Parameters
-
axis axis index dataset index
- Returns
- dataset at index

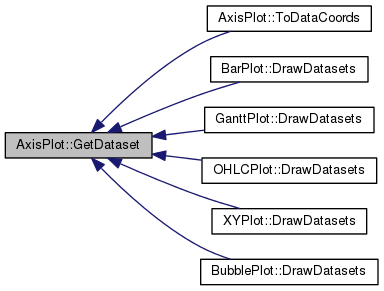
| Dataset * AxisPlot::GetDataset | ( | size_t | index | ) |
Return dataset with index
- Parameters
-
index index of dataset
- Returns
- dataset or NULL if index is out of bounds
Returns dataset axis.
- Parameters
-
dataset dataset index axis index, 0 - for main axis vertical true if you want to get vertical axis, false - horizontal
- Returns
- main axis for dataset or NULL if dataset has no main axis


Returns main dataset axis. NOTE: main axis is the first axis linked with dataset. Main axis is used to scale dataset values.
- Parameters
-
dataset dataset vertical true if you want to get vertical axis, false - horizontal
- Returns
- main axis for dataset or NULL if dataset has no main axis

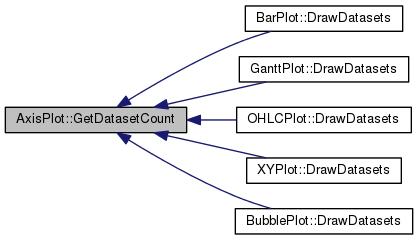
| size_t AxisPlot::GetDatasetCount | ( | ) |
Returns dataset count.
- Returns
- dataset count
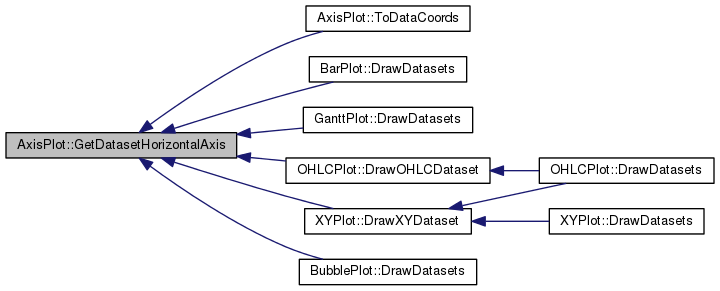
Returns main horizontal dataset axis. NOTE: main axis is the first axis linked with dataset. Main axis is used to scale dataset values.
- Parameters
-
dataset dataset
- Returns
- main axis for dataset or NULL if dataset has no main axis
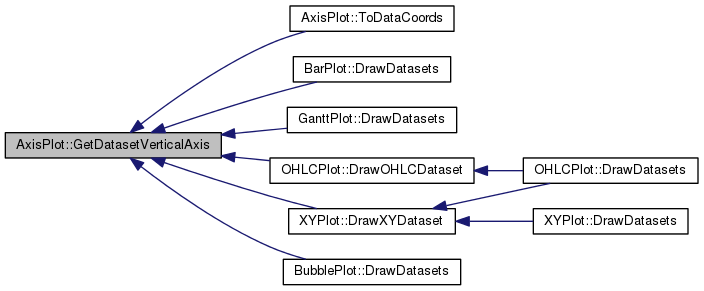
Returns main vertical dataset axis. NOTE: main axis is the first axis linked with dataset. Main axis is used to scale dataset values.
- Parameters
-
dataset dataset
- Returns
- main axis for dataset or NULL if dataset has no main axis
| void AxisPlot::LinkDataHorizontalAxis | ( | size_t | nData, |
| size_t | nAxis | ||
| ) |
Links dataset with horizontal axis
- Parameters
-
nData index of dataset nAxis index of horizontal axis

| void AxisPlot::LinkDataVerticalAxis | ( | size_t | nData, |
| size_t | nAxis | ||
| ) |
Links dataset with vertical axis
- Parameters
-
nData index of dataset nAxis index of vertical axis

|
virtual |
Called when object is need to be redrawed.
- Parameters
-
obj object that need to be redrawed
Implements DrawObserver.
| void AxisPlot::RemoveDataset | ( | Dataset * | dataset | ) |
Removes dataset from plot.
- Parameters
-
dataset dataset to be removed
| void AxisPlot::RemoveDataset | ( | size_t | index | ) |
Removes dataset from plot.
- Parameters
-
dataset dataset index to be removed
| void AxisPlot::SetCrosshair | ( | Crosshair * | crosshair | ) |
Attaches crosshair to this plot.
- Parameters
-
crosshair crosshair
| void AxisPlot::SetDataBackground | ( | AreaDraw * | dataBackground | ) |
Sets background for data area.
- Parameters
-
dataBackground background for data area
| void AxisPlot::SetDrawGrid | ( | bool | drawGridVertical, |
| bool | drawGridHorizontal | ||
| ) |
Set whether to draw grid lines.
- Parameters
-
drawGridVertical if true - plot will draw vertical grid lines drawGridHorizontal if true - plot will draw horizontal grid lines
| void AxisPlot::SetLegend | ( | Legend * | legend | ) |
Sets legend to plot. Plot take ownership of legend.
- Parameters
-
legend new legend for plot
| bool AxisPlot::ToDataCoords | ( | size_t | nData, |
| wxDC & | dc, | ||
| wxRect | rc, | ||
| wxCoord | gx, | ||
| wxCoord | gy, | ||
| double * | x, | ||
| double * | y | ||
| ) |
Translate coordinate from graphics to data space.
- Parameters
-
nData number of dataset dc device context rc plot rectangle gx x coordinate in graphics space gy y coordinate in graphics space x output for x coordinate in data space y output for y coordinate in data space
- Returns
- true if coordinate was succesfully translated, false - overwise

The documentation for this class was generated from the following files:
- /home/bishop/work/projects/nextgismanager/include/freechart/wx/axisplot.h
- /home/bishop/work/projects/nextgismanager/src/freechart/axisplot.cpp


